- Home Page /
- Books /
- Science & Math /
- Biological Sciences /
- Biology /
- Biostatistics /
- Data Analysis and Graphics Using R: An Exampl...





Data Analysis and Graphics Using R: An Example-Based Approach (Cambridge Series in Statistical and Probabilistic Mathematics, Series Number 10)
85% of respondents would recommend this to a friend
 Imported from USA store

Ubuy works hard to protect your security and privacy. Our advanced payment security system ensures confidentiality by encrypting your information during transmission using AES (Advanced Encryption Standards) and SSL (Secure Socket Layer) protocols. Your payment details are 100% secure as we do not share your payment details with third party sellers.


Fast
Shipping

Free
Return*

Secure Packaging

100% Original Products

PCI DSS Compliance

ISO 27001 Certified

















Product Details
- Discover what you can do with R! Introducing the R system, covering standard regression methods, then tackling more advanced topics, this book guides users through the practical, powerful tools that the R system provides. The emphasis is on hands-on analysis, graphical display, and interpretation of data. The many worked examples, from real-world research, are accompanied by commentary on what is done and why. The companion website has code and datasets, allowing readers to reproduce all analyses, along with solutions to selected exercises and updates. Assuming basic statistical knowledge and some experience with data analysis (but not R), the book is ideal for research scientists, final-year undergraduate or graduate-level students of applied statistics, and practicing statisticians. It is both for learning and for reference. This third edition expands upon topics such as Bayesian inference for regression, errors in variables, generalized linear mixed models, and random forests.
| Publisher | Cambridge University Press |
| Publication date | June 7, 2010 |
| Edition | 3rd |
| Language | English |
| Print length | 549 pages |
| ISBN-10 | 0521762936 |
| ISBN-13 | 978-0521762939 |
| Item Weight | 2.87 pounds (1.3 kg) |
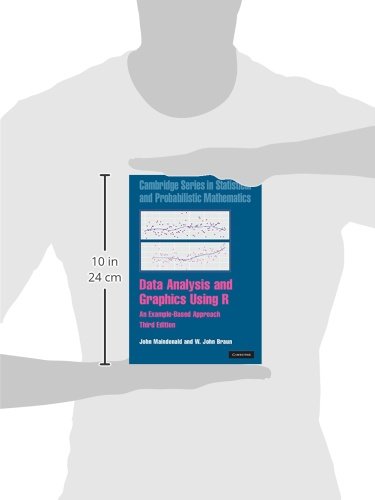
| Dimensions | 7.25 x 1.25 x 10 inches (18.4 x 3.2 x 25.4 cm) |
| Part of series | Cambridge Series in Statistical and Probabilistic Mathematics |
Product Description
Data Analysis and Graphics Using R: An Example-Based Approach (Cambridge Series in Statistical and Probabilistic Mathematics, Series Number 10)
Important information
- Limitations : For products shipped internationally, please note that any manufacturer warranty may not be valid; manufacturer service options may not be available; product manuals, instructions, and safety warnings may not be in destination country languages; the products (and accompanying materials) may not be designed in accordance with destination country standards, specifications, and labeling requirements; and the products may not conform to destination country voltage and other electrical standards (requiring use of an adapter or converter if appropriate). The recipient is responsible for assuring that the product can be lawfully imported to the destination country. When ordering from Ubuy or its affiliates, the recipient is the importer of record and must comply with all laws and regulations of the destination country.
- Not all the products listed on Ubuy are for sale, as Ubuy is a global search engine. Products are subject to export/trade regulations.
Currently unavailable.
We don't know when or if this item will be back in stock.
This item is not restrict in my country.(Please click on above link if this item is not restrict in your country, So our team will review and allow.)
PCI DSS compliant and ISO 27001:2022 certified, with encrypted payments and full buyer protection on every order.
Ubuy Assurance
Experience worry-free shopping with 100% original products, PCI DSS-compliant payment security, ISO 27001-certified data protection, the fastest cross-border delivery, free returns *, and secure packaging on every order.